Projects
Our projects sit at the intersection of people, place, and data. We work with industry partners, heritage organizations, municipalities, and tourism stakeholders to understand and improve how people experience places.
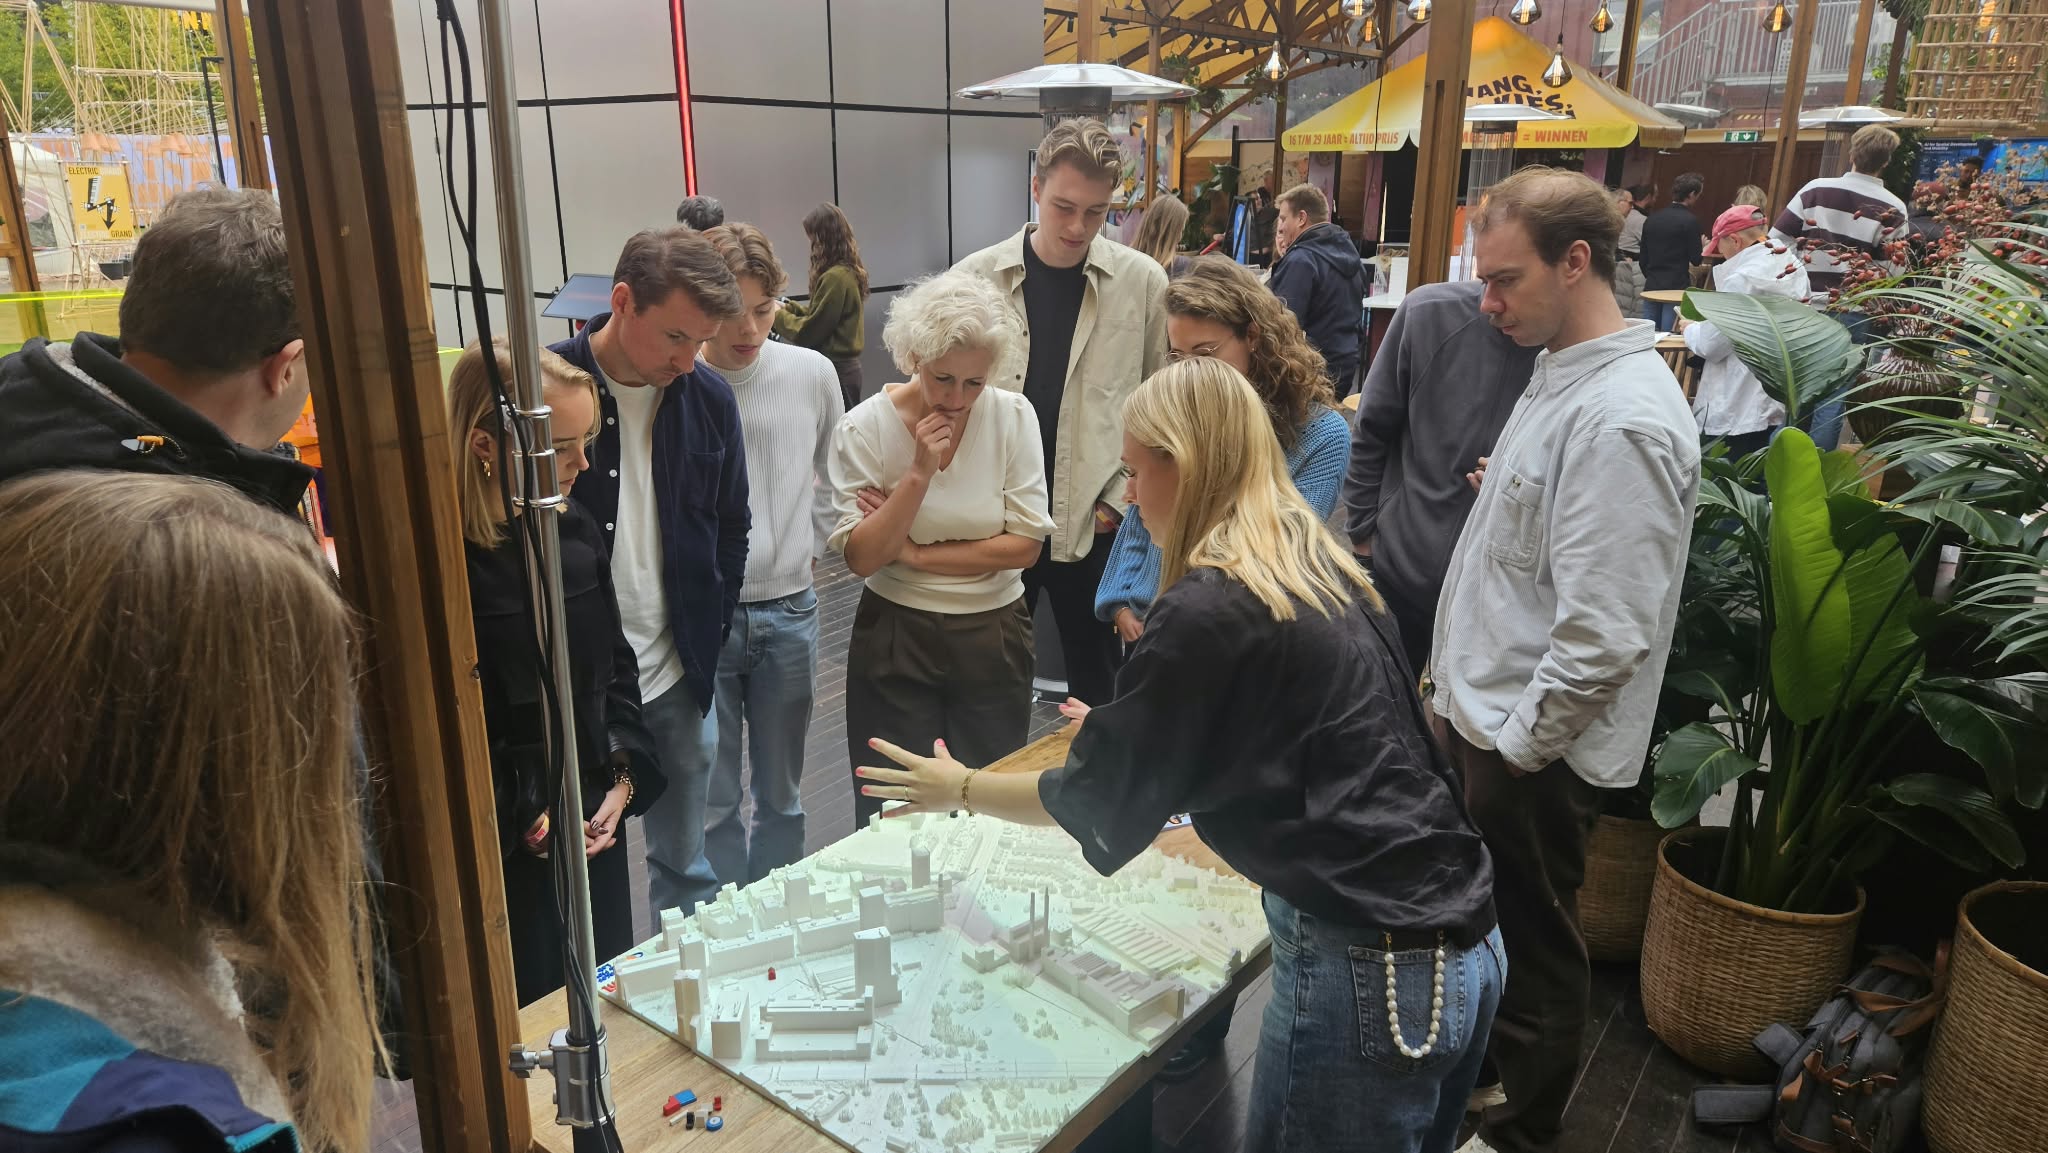
Making urban complexity tangible
SmartwayZ.NL came to the Places & Flows Lab with a complex spatial challenge: the traffic situation around Strijp-S in Eindhoven. Together, we turned the data behind it into a 3D-printed model with projected data layers, and presented it at Dutch Design Week 2026 for everyone to explore.
The challenge
Strijp-S is the heart of Dutch Design Week, but also one of the busiest and most complex places in Eindhoven to walk and cycle. On the Torenallee, pedestrians, terraces and cyclists share the same space. At its end, the Strijps Bultje viaduct carries the Ring road over a tangle of crossing routes, and the Ring separates Strijp-S from Strijp-T. The viaduct is nearing the end of its structural life, so the area faces choices that will shape it for decades.
How we worked together
SmartwayZ.NL brought the challenge and the questions behind it. We sat down together to decide what people needed to see to understand the area, and which data could show it. Our lab then translated that complex geospatial data into tangible insights: a physical model of the area, with data projected onto it layer by layer.
The goal was not to present a ready-made answer. It was to make the problem visible and understandable for everyone, so that people could start thinking about it together.
Why tangible data makes a difference
Paper maps and 2D screens ask people to imagine the real place. A physical model doesn’t. Visitors recognised the streets right away, gathered around the table and started discussing with each other. When a problem is easy to see and understand, everyone can join the conversation, not just experts. That is where better ideas and creative solutions begin.
We believe better ideas emerge when data becomes tangible.
Working with us
Do you have a geospatial challenge? You bring the question, and we sit down together to turn the data into insights everyone can see and understand. Contact us at placesandflows@buas.nl.

The challenge
A walking route or a historic site can evoke moments of calm, excitement, stress or awe. For heritage managers, knowing where these moments happen is key to creating a visit that is not only efficient, but also meaningful and memorable. Visitor counts and surveys show where people go, but not how they feel along the way.

How we did it

Visitors wore the Shimmer GSR+, a wearable wrist device with finger sensors and a gold-standard tool for measuring skin conductance. It records subtle changes in sweating of the skin, one of the most sensitive indicators of emotional arousal. We combined these signals with GPS data, so every moment could be linked to a place on the site.
We then projected the results onto a physical model of the fortress with our Tangible Landscape. This made it easy to see at a glance where visitors felt tense, excited or relaxed.
What it’s used for
The emotion maps help heritage managers understand how visitors respond to different spaces. They support decisions on redesigning visitor flows and improving the overall experience of the site.
Last-mile deliveries & traffic jams
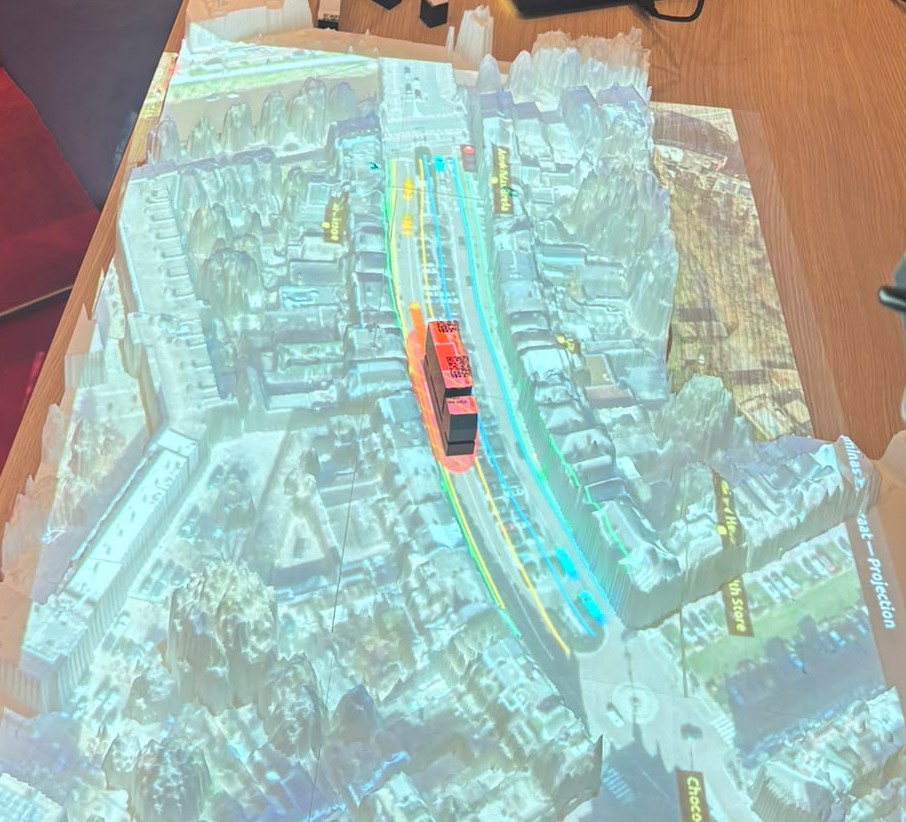
What happens when a delivery truck stops in the street to unload? As part of LILS, our lab built a live traffic simulation on a 3D-printed model of the Wilhelminastraat in Breda. Stakeholders could place a truck on the street and watch a traffic jam build up and clear, right in front of them.
The challenge
Last-mile deliveries keep shops and homes supplied, but they also put pressure on city streets. When a truck stops on the road to unload, the cars behind it have to wait. Everyone knows this happens, but it is hard to grasp how quickly a jam builds up, how long it lasts and what a different street layout could change. Numbers in a report rarely make that clear.
What we built
We 3D-printed the Wilhelminastraat and the streets around it, and projected a live traffic simulation onto the model. Cars drive along the streets and the traffic lights change in real time. The traffic is based on real data we collected on the street. It isn’t a live feed, but it means the traffic on the model flows the way it does on the actual street.
How it works
Visitors place a model truck on the street, as if it has parked to make a delivery. The simulation responds immediately: the cars behind the truck stop, and a queue starts to grow. When the truck is removed, the queue slowly clears.
This shows two things that are hard to see in a report: how fast a jam builds up, and how long it takes to resolve once the truck has gone.
Around the table
Because the simulation is interactive, stakeholders didn’t just watch a presentation. They gathered around the table, placed the truck themselves and saw the problem happen live. That shared picture made it easier to understand the impact of a single delivery stop, and to discuss possible solutions together.
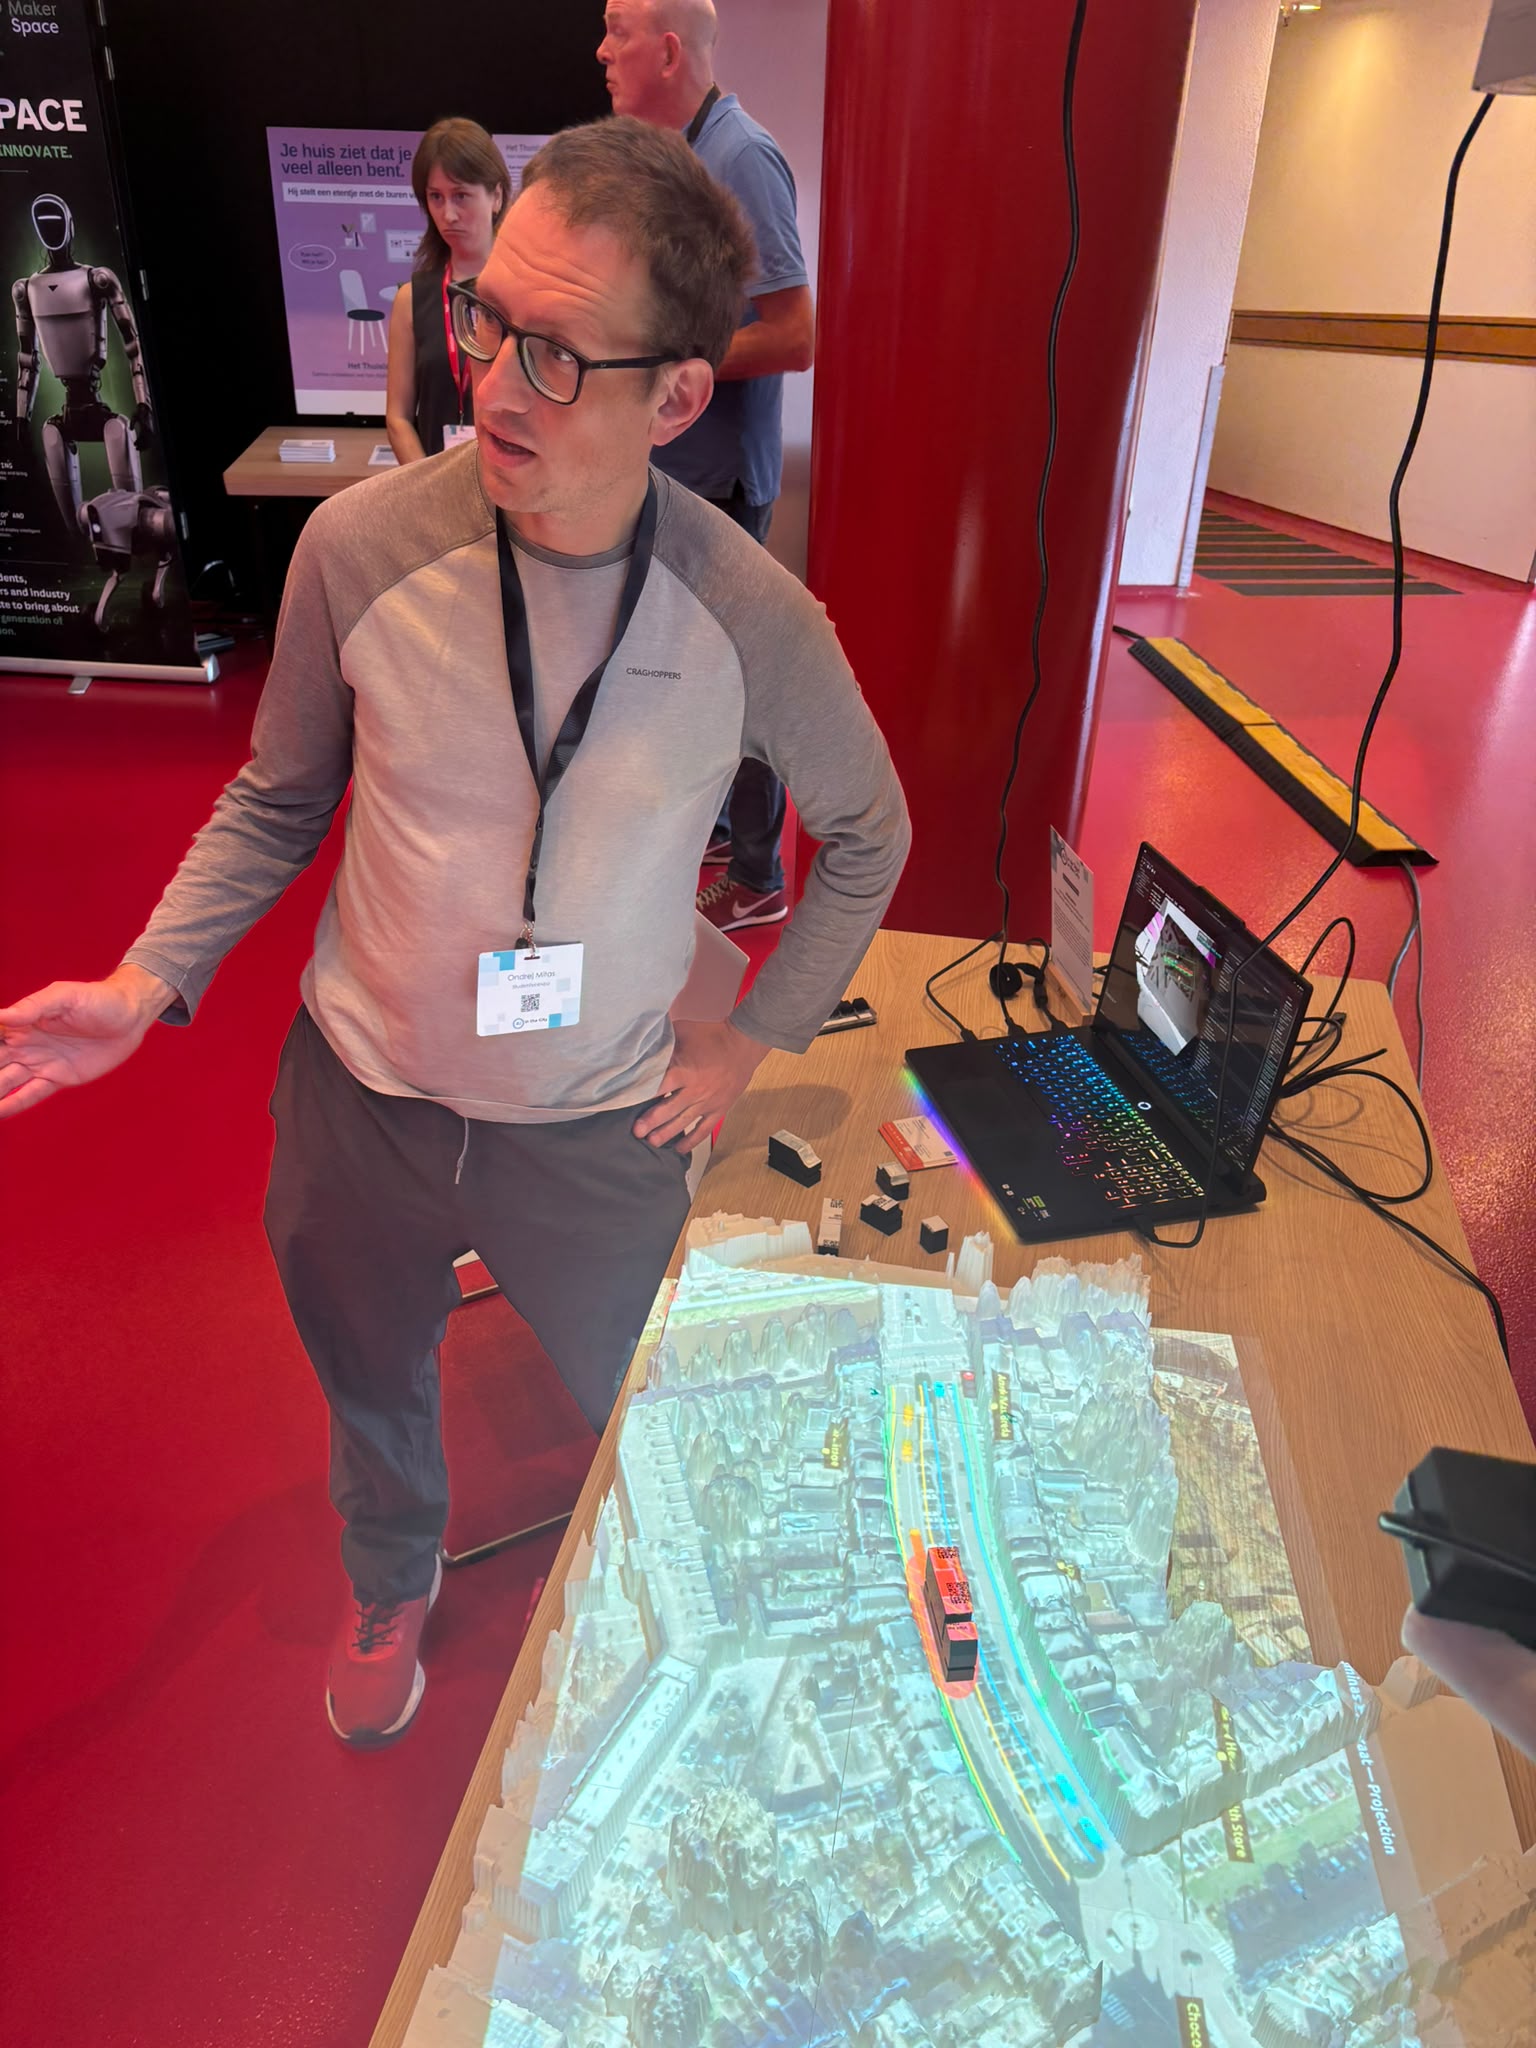
The simulation runs on CNG, our new platform that makes tangible landscapes easier to set up and use.
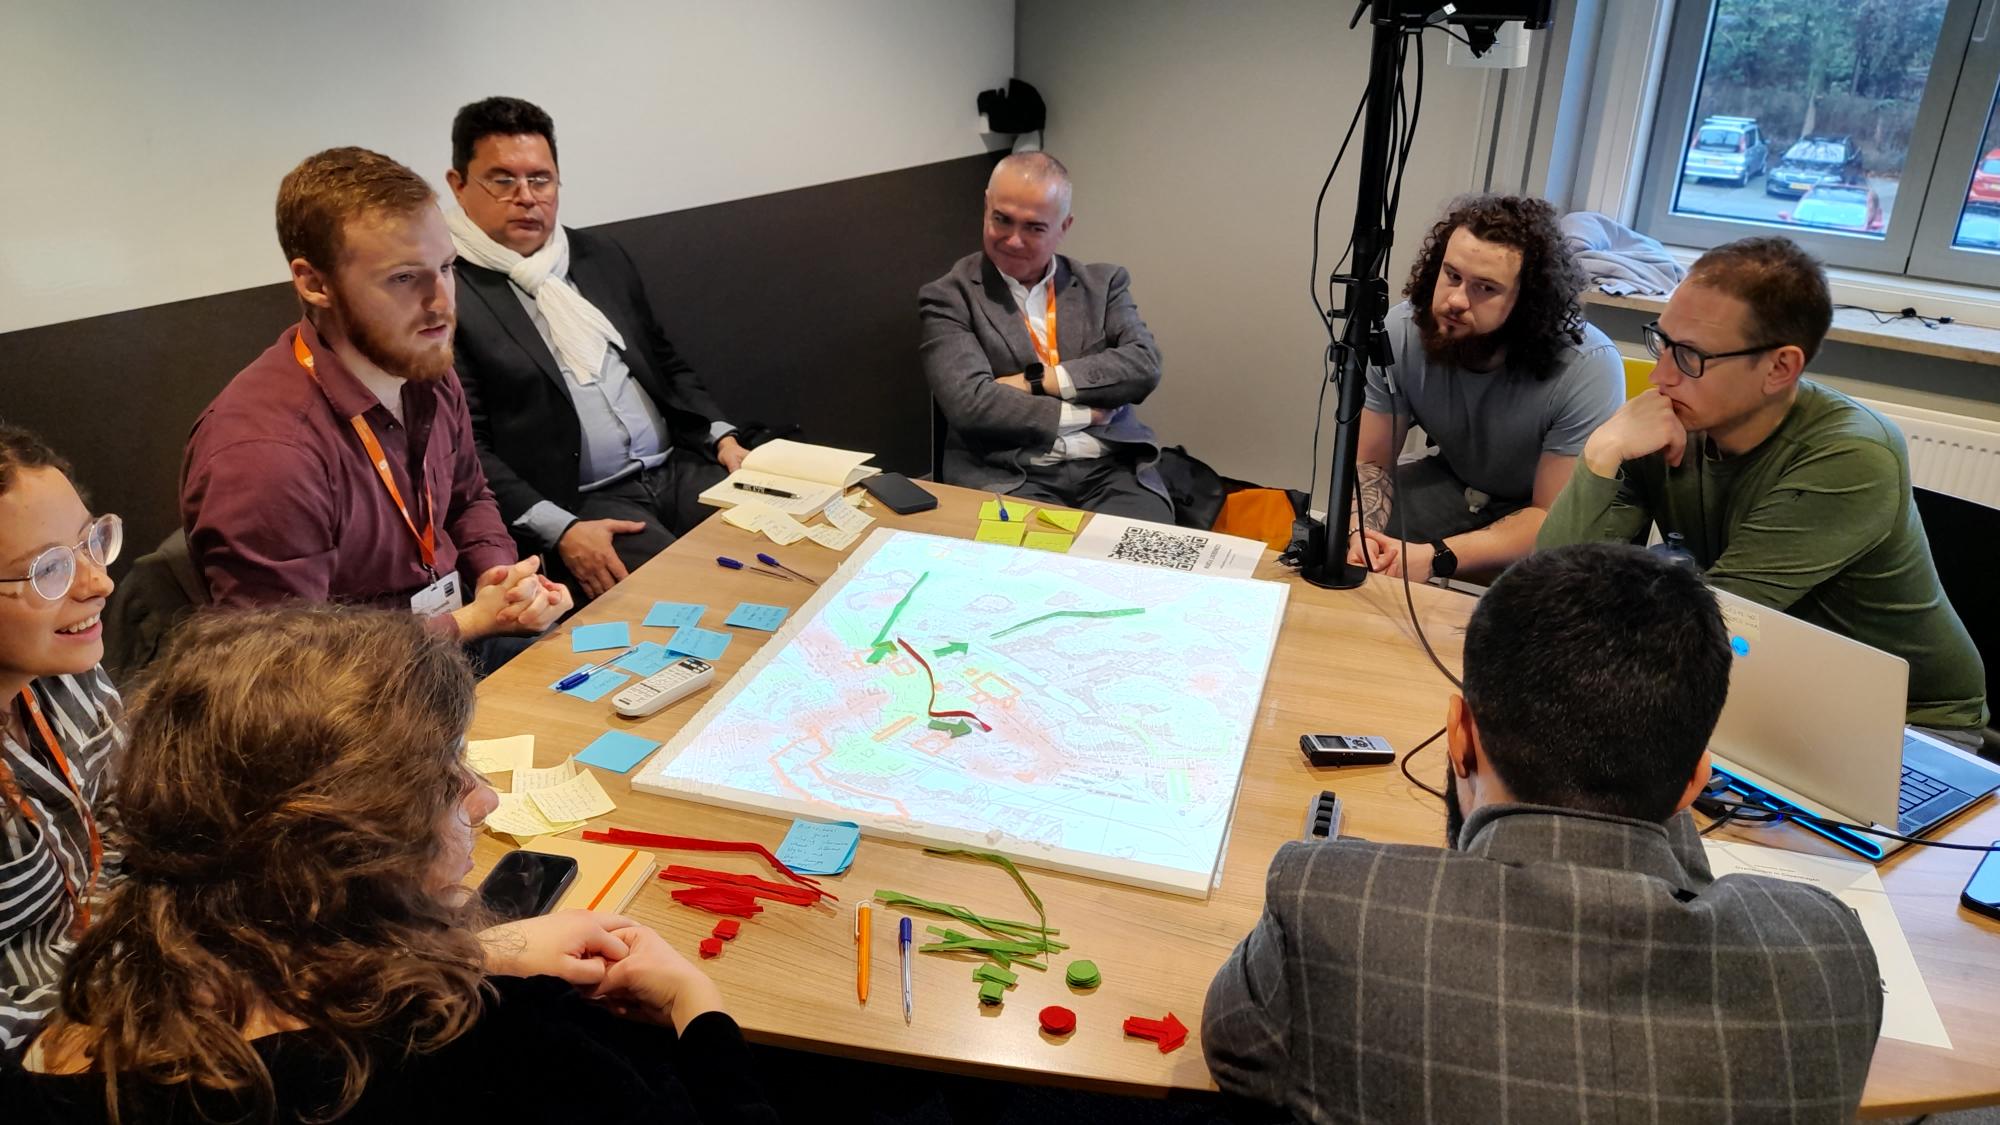
Putting overtourism on the map
How do you get people with different interests to agree on a plan against overtourism? We ran a series of workshops with tourism experts to compare four facilitation methods, from conventional brainstorming to our Tangible Landscape. The tangible version led to the most creative ideas and the most engaging discussions.
The challenge
Tackling overtourism means bringing together people with different and sometimes conflicting perspectives, and finding strategies they can all accept. There is no shortage of consultants to guide these sessions, yet there is little visible progress on the ground. A new way of facilitating these conversations is needed.
Play could be part of the answer. Play creates positive emotions, encourages connection and helps people let their guard down. We wanted to find out which approach works best in practice.
What we tested
We compared four facilitation methods:
- Conventional facilitation, using a rapid prototyping approach
- Lego Serious Play, where participants build their ideas with Lego
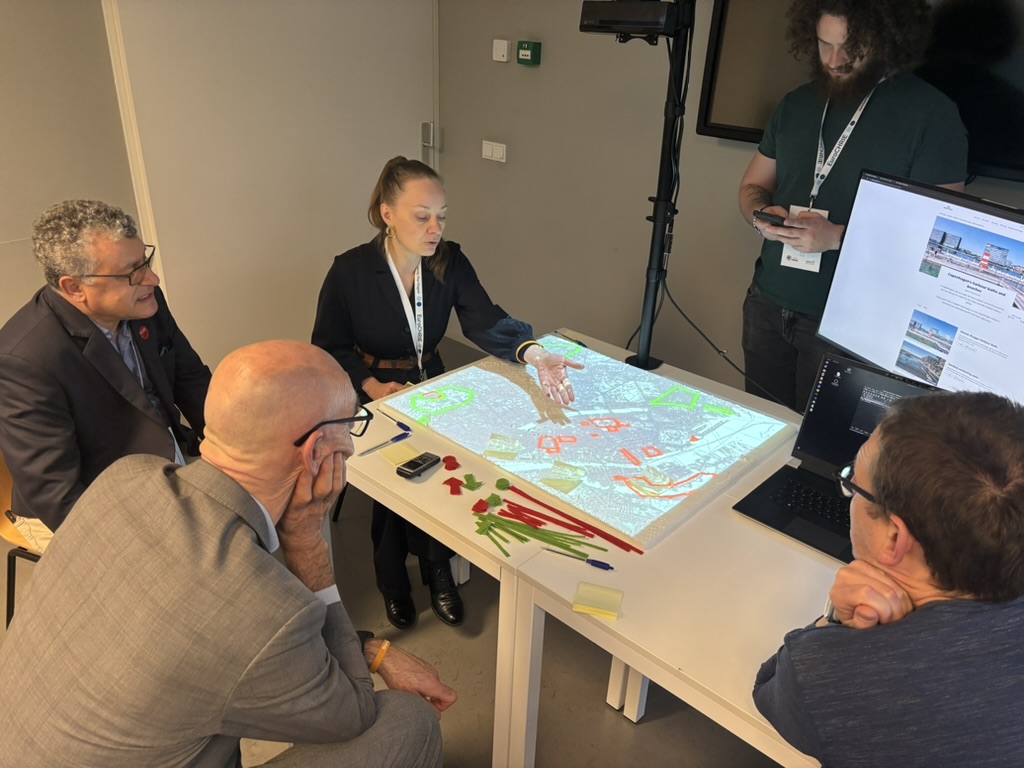
- Tangible Landscape, where data is projected onto a physical model that participants can change by hand
- AugGIS, where participants change a map with hand gestures in augmented reality
Each method was tested in several 45-minute workshops with groups of five participants from tourism research and practice. Every group got the same challenge: a map of a city showing attractions that need more visitors, attractions that need fewer, and how tourists move between them. With the help of a trained facilitator, the group had to design a workable intervention to reduce overtourism.
How we measured it
We observed how participants spoke and took turns, and how many ideas and alternative perspectives they came up with. We also looked at the emotions they showed and how those spread through the group. Afterwards, participants rated how much they enjoyed the session and whether they would share and implement the ideas.
What we found
The Tangible Landscape stood out. Groups working around the physical model came up with more creative ideas and had more engaging discussions than with the other methods. Seeing the city and its tourist flows on the table gave everyone the same picture to point at, question and build on.
The research was carried out by Ondrej Mitas, Alinda Kokkinou, Wilco Boode and Jeroen Klijs.
The Blind Walls Gallery
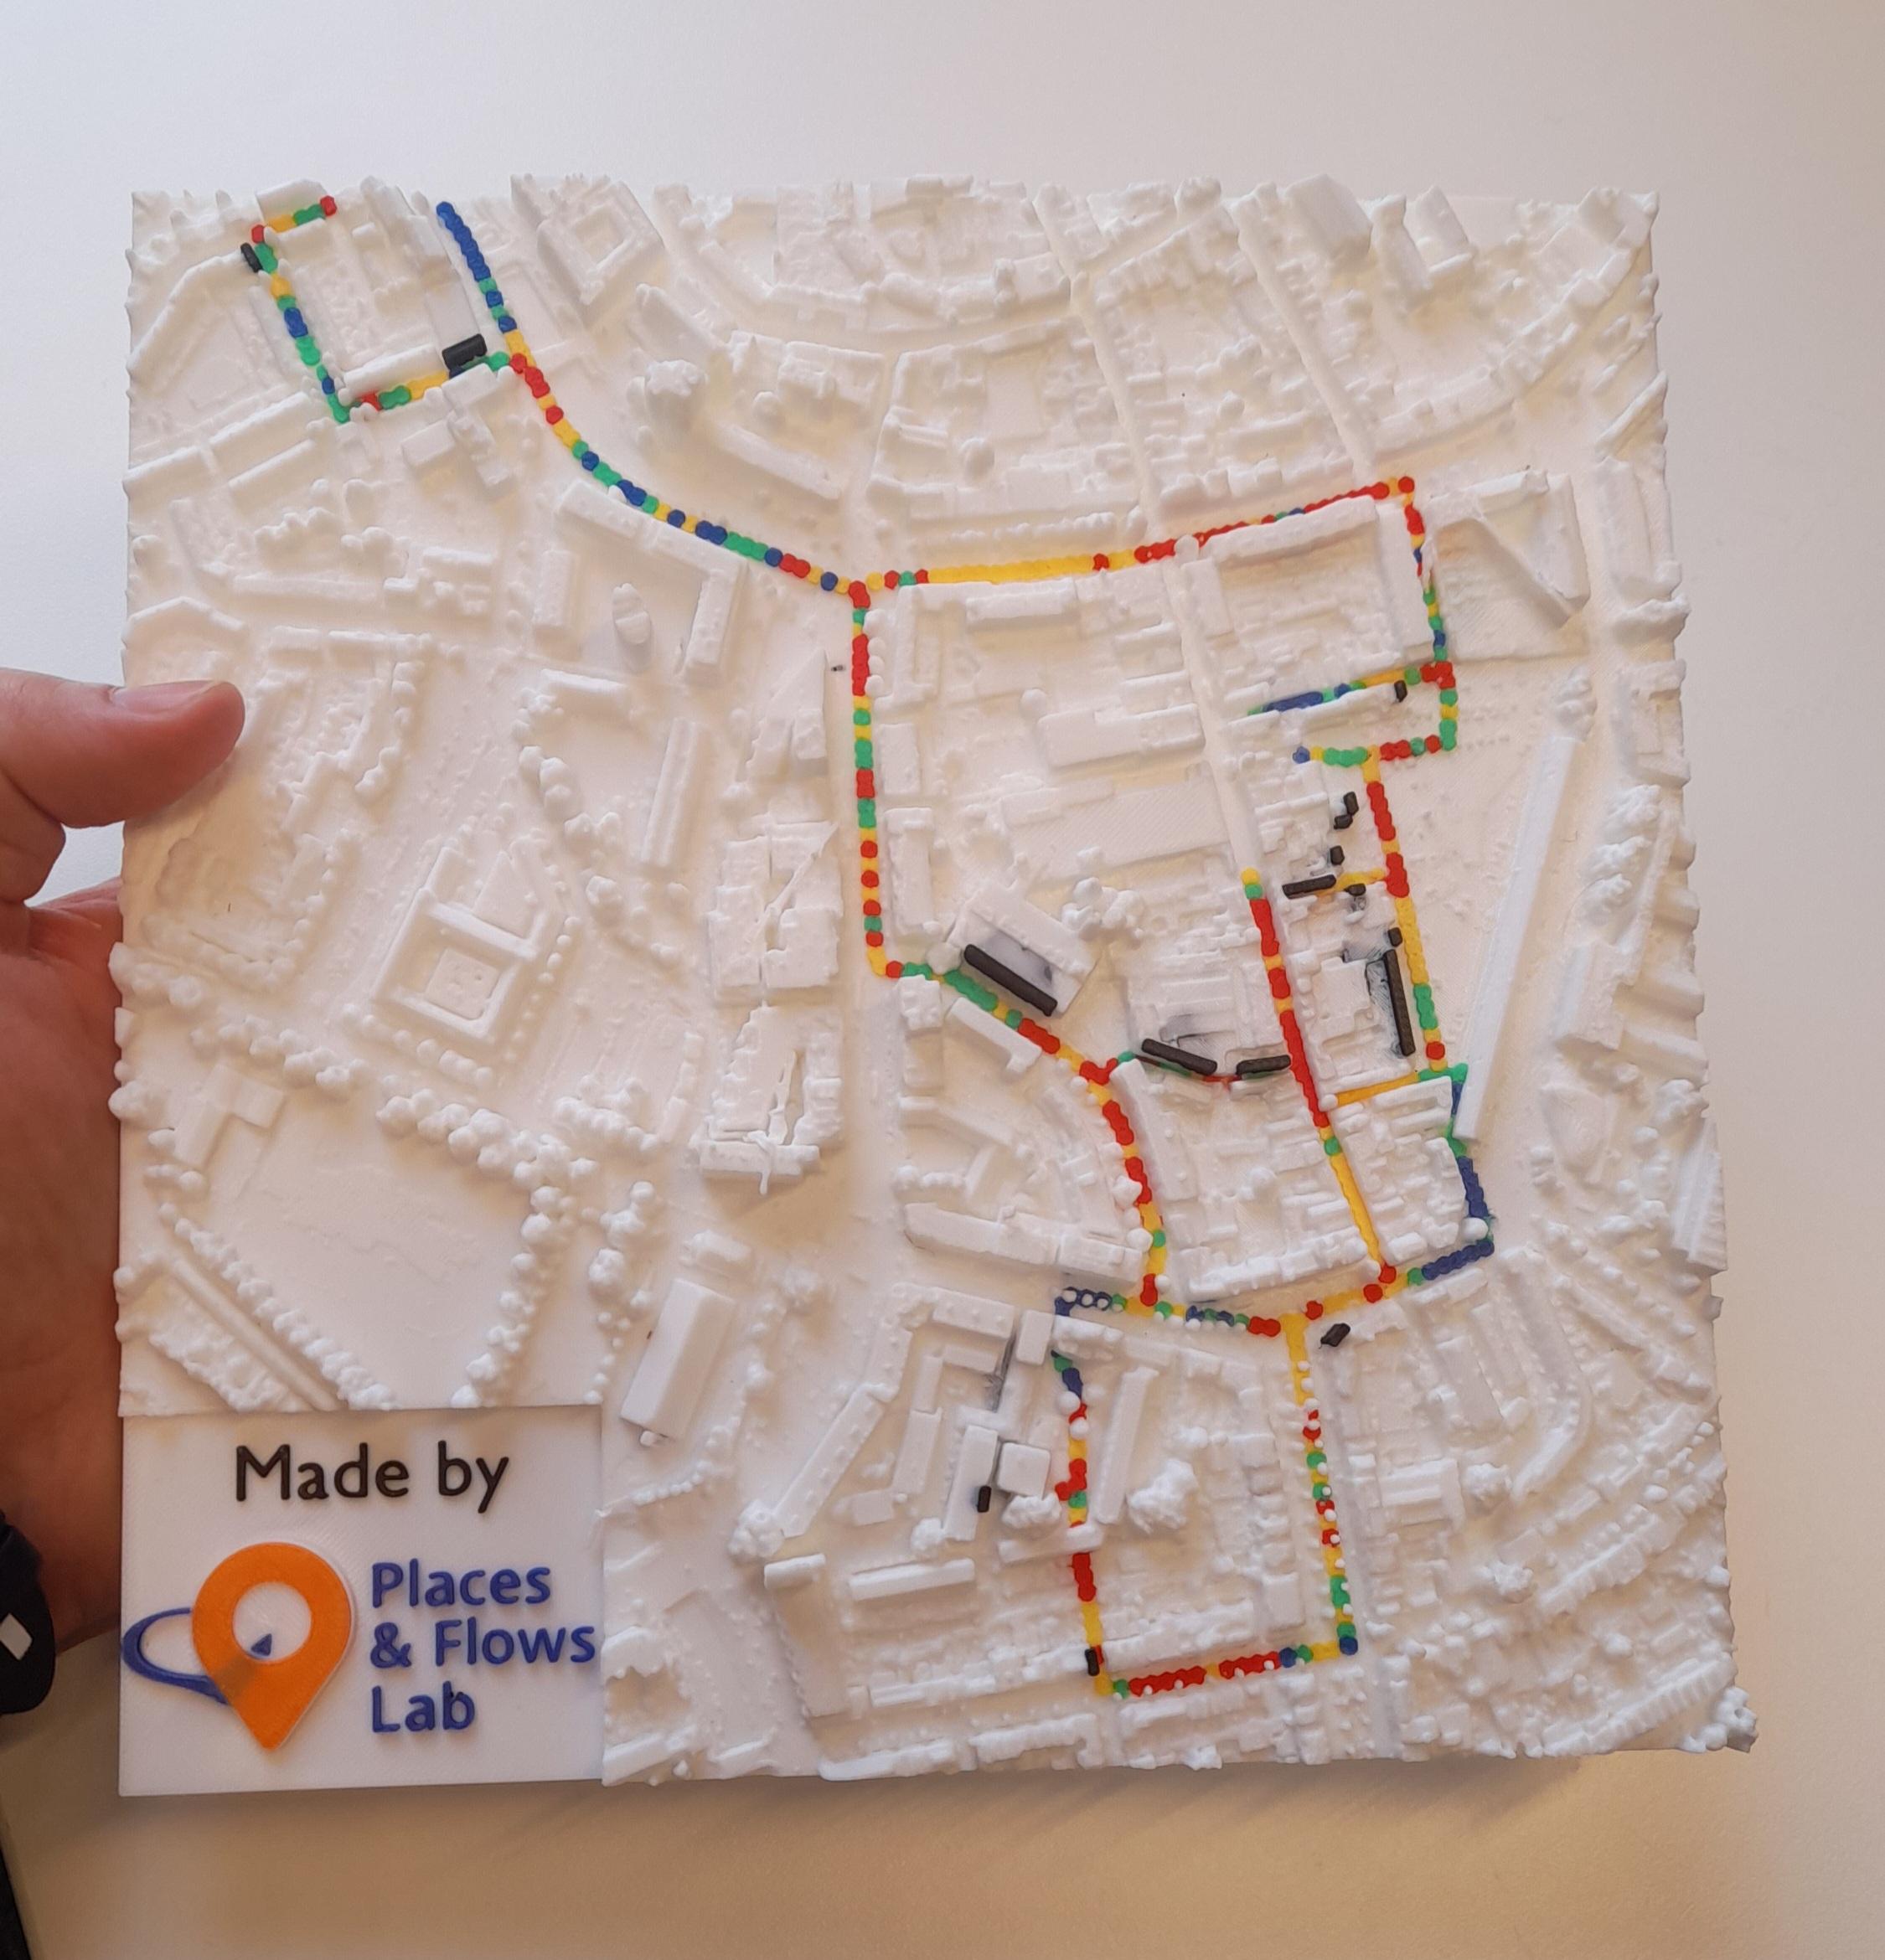
Blind Walls Gallery is an open-air museum in Breda. Artists paint large murals on the city’s bare walls, each inspired by a local story, and visitors discover them on guided tours.
What our lab adds
A tour is more than a route from wall to wall. It is an emotional journey, with moments of surprise, excitement and calm. That journey is usually invisible: visitor counts and reviews show where people went, not how they felt on the way.
Our lab makes that journey visible. Imagine holding the city in your hands and seeing, street by street, where the tour gripped visitors the most and where their attention dropped.
How we measured it
Visitors on the tour wore the Shimmer GSR+, a wearable wrist device with finger sensors that measures skin conductance. Tiny changes in sweating of the skin are one of the most sensitive indicators of emotional arousal. Combined with GPS, every moment of the tour is linked to a place in the city.
Arousal shows how strongly something is felt, not whether the feeling is positive or negative. A peak can mean excitement, surprise or awe.
A city you can hold in your hand
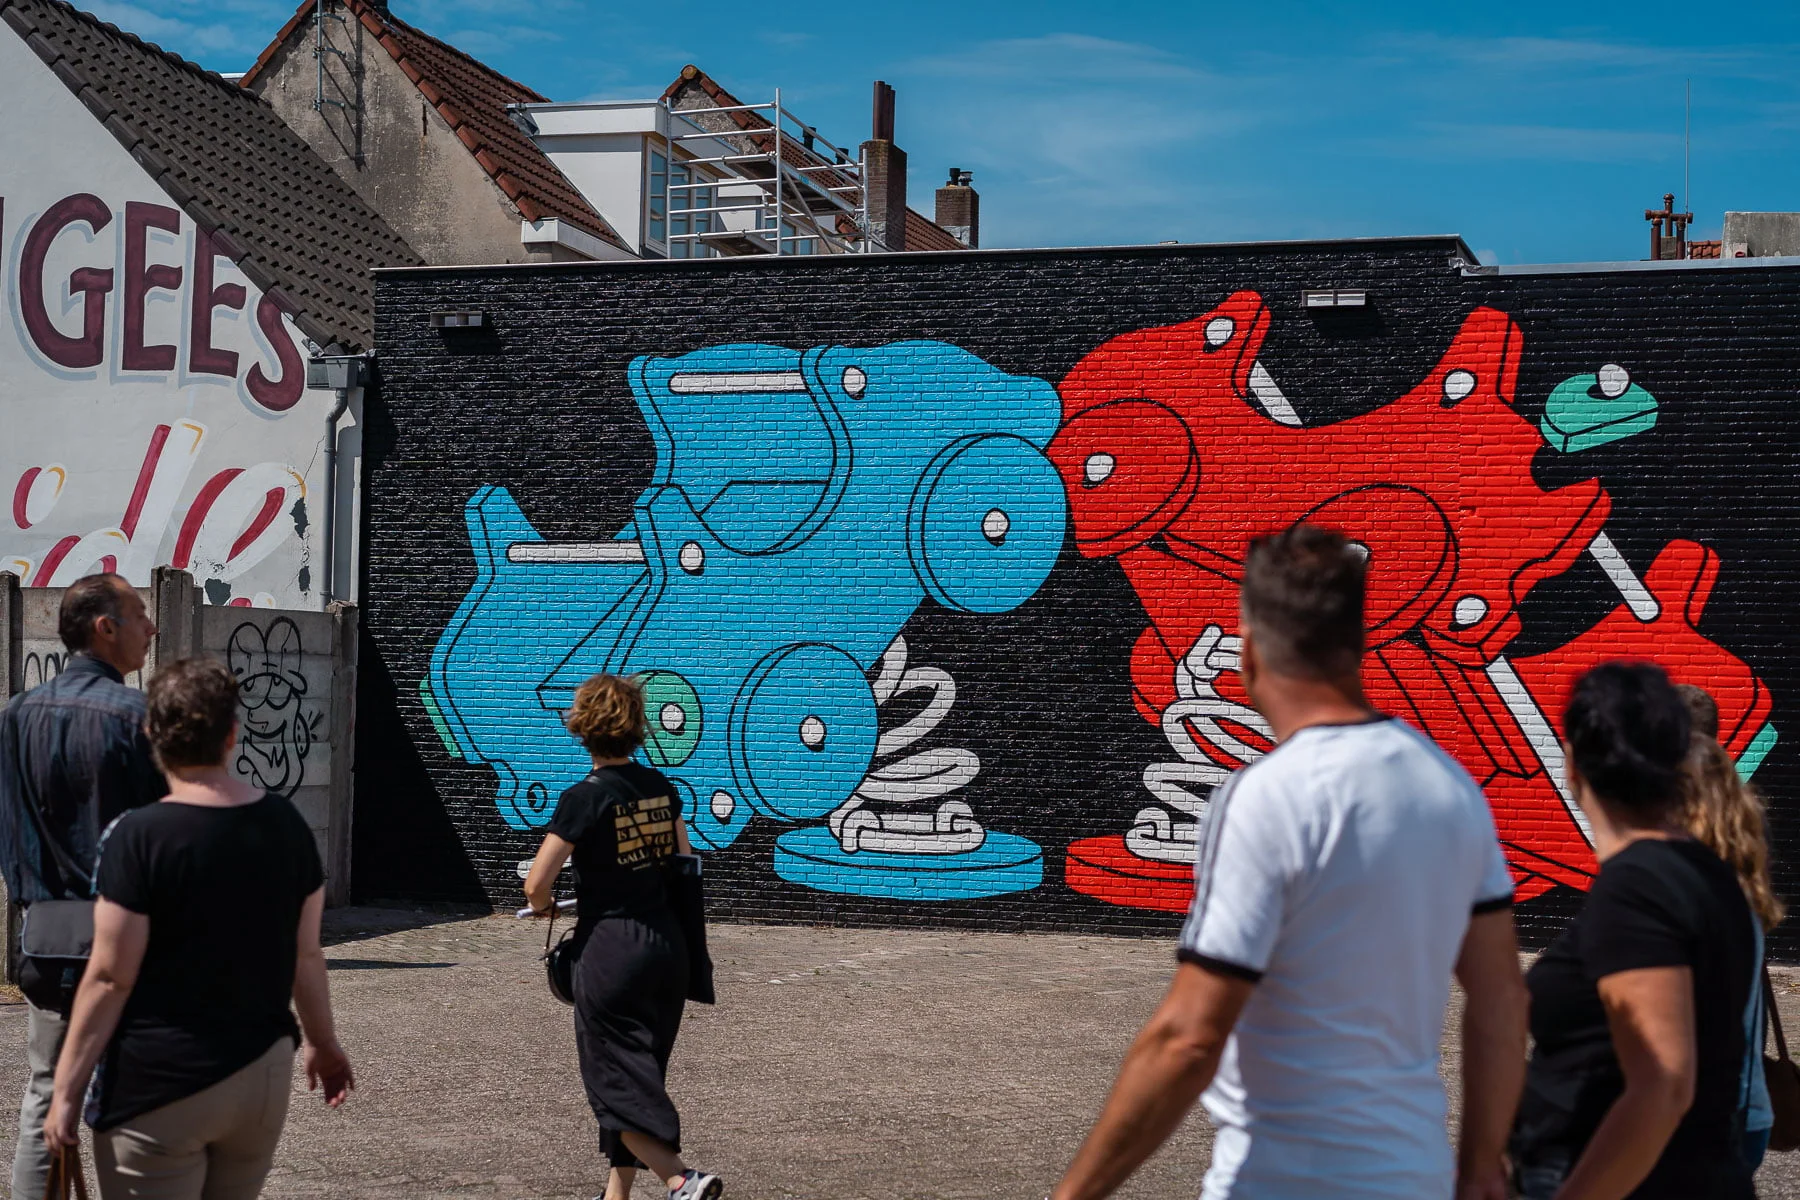
We 3D-printed the city centre with the tour route on it in colour: blue for the lowest arousal, then green, yellow and red for the highest. The murals stand out in black.
Why a model in your hand
On an aerial photo or a 2D map, the murals are hard to pick out between rooftops, streets and parking spaces. Seen from the same angle on the model, you know right away where each wall is.
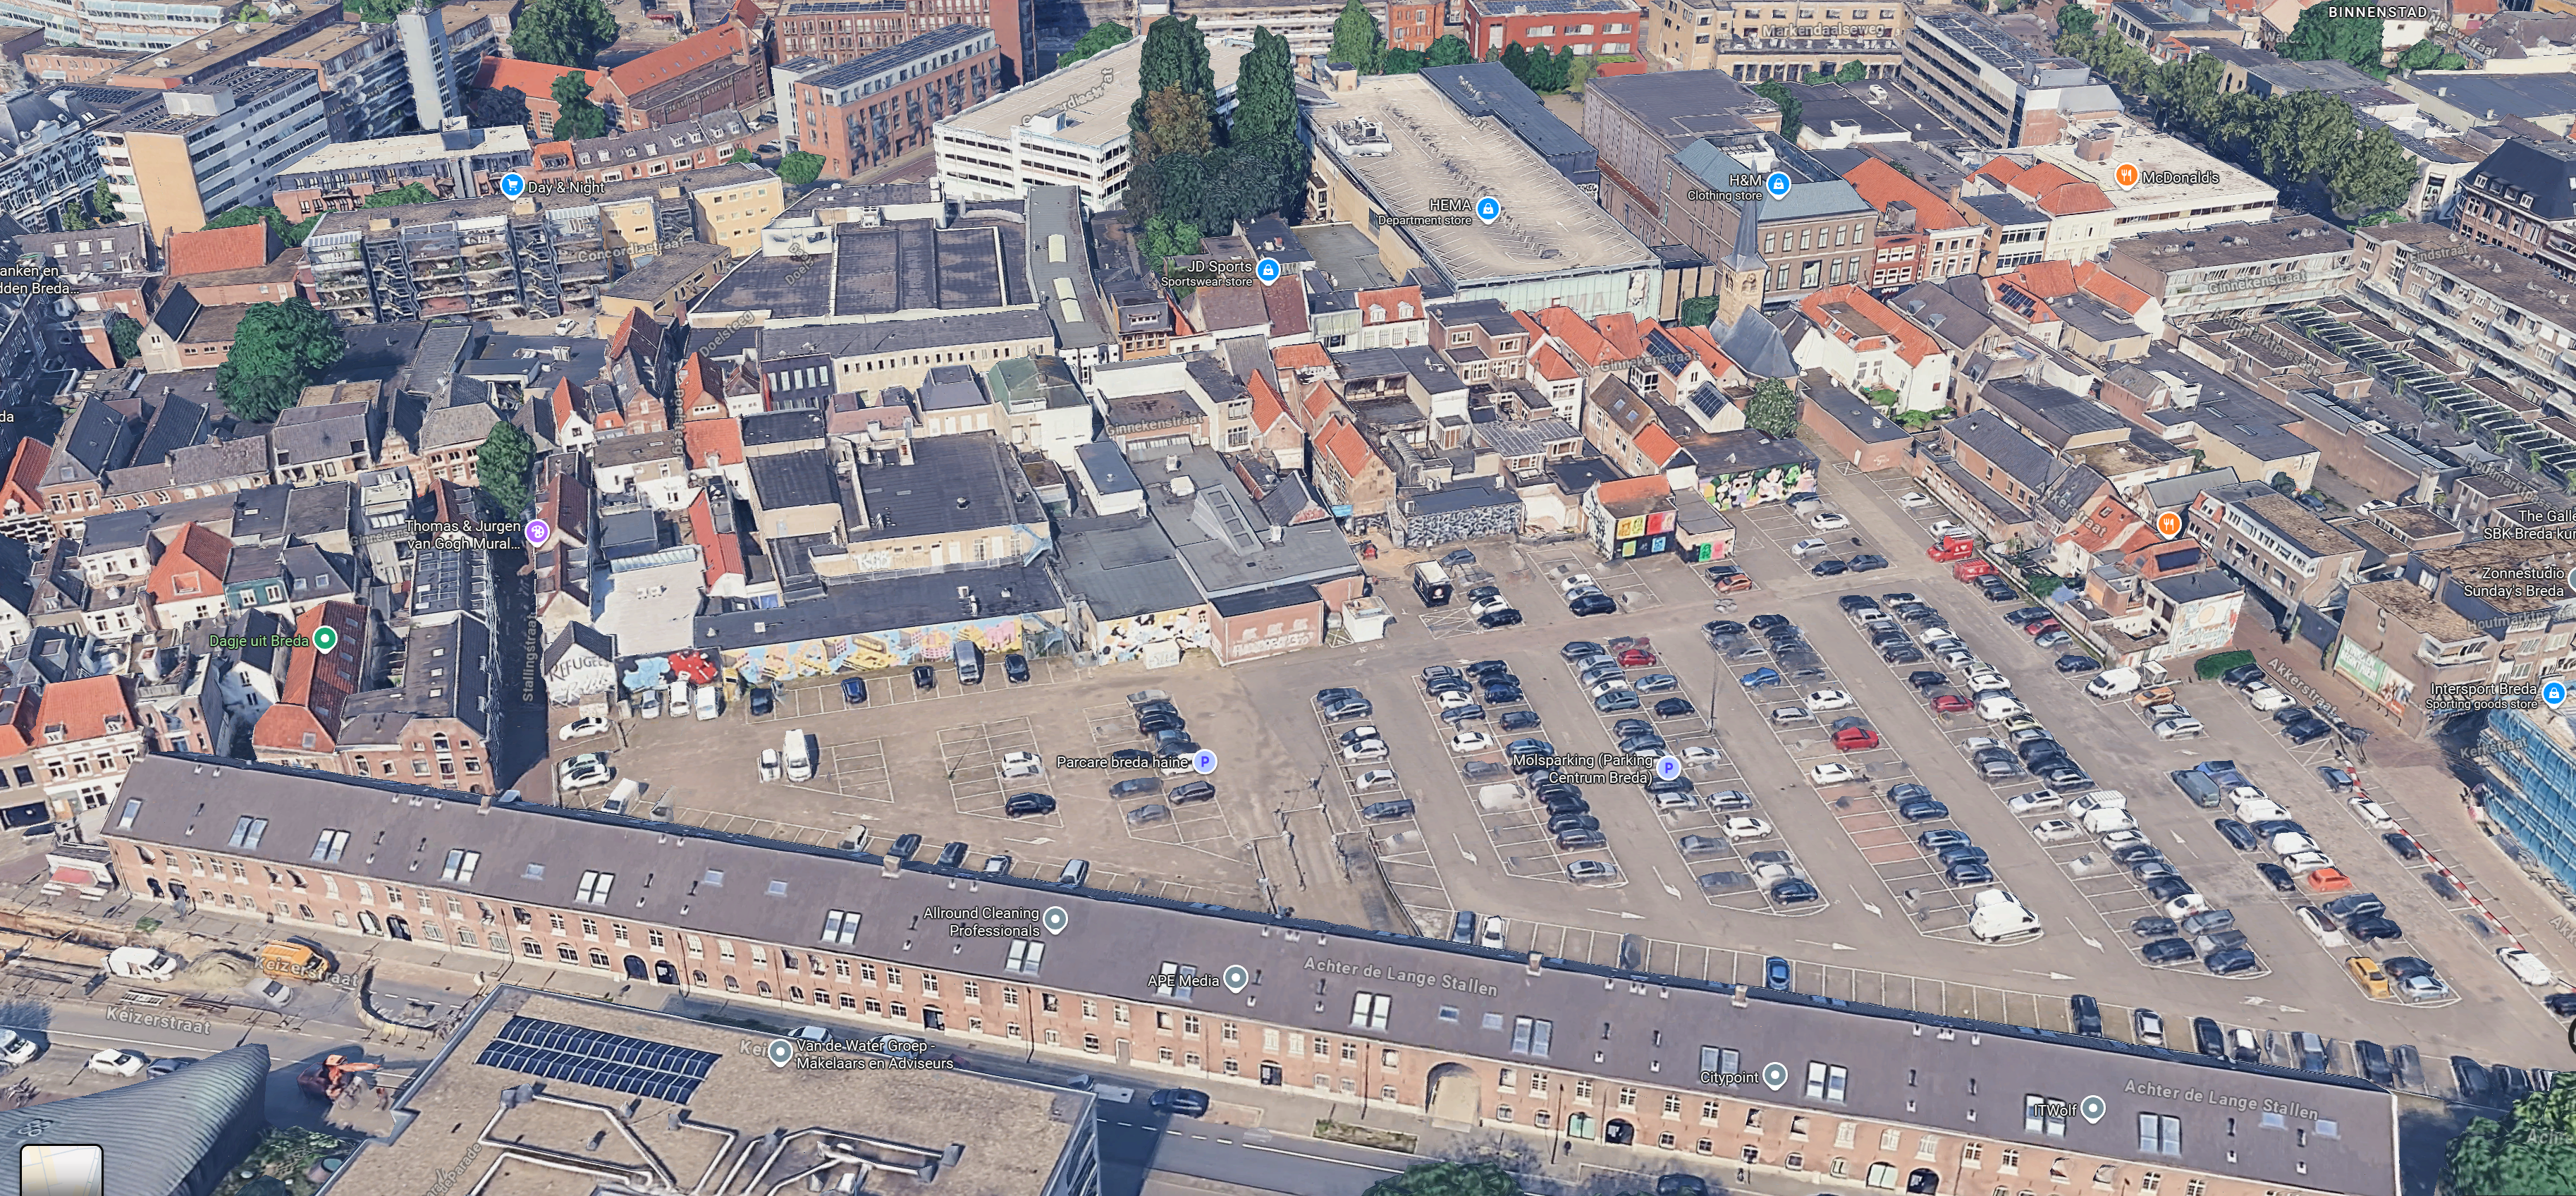
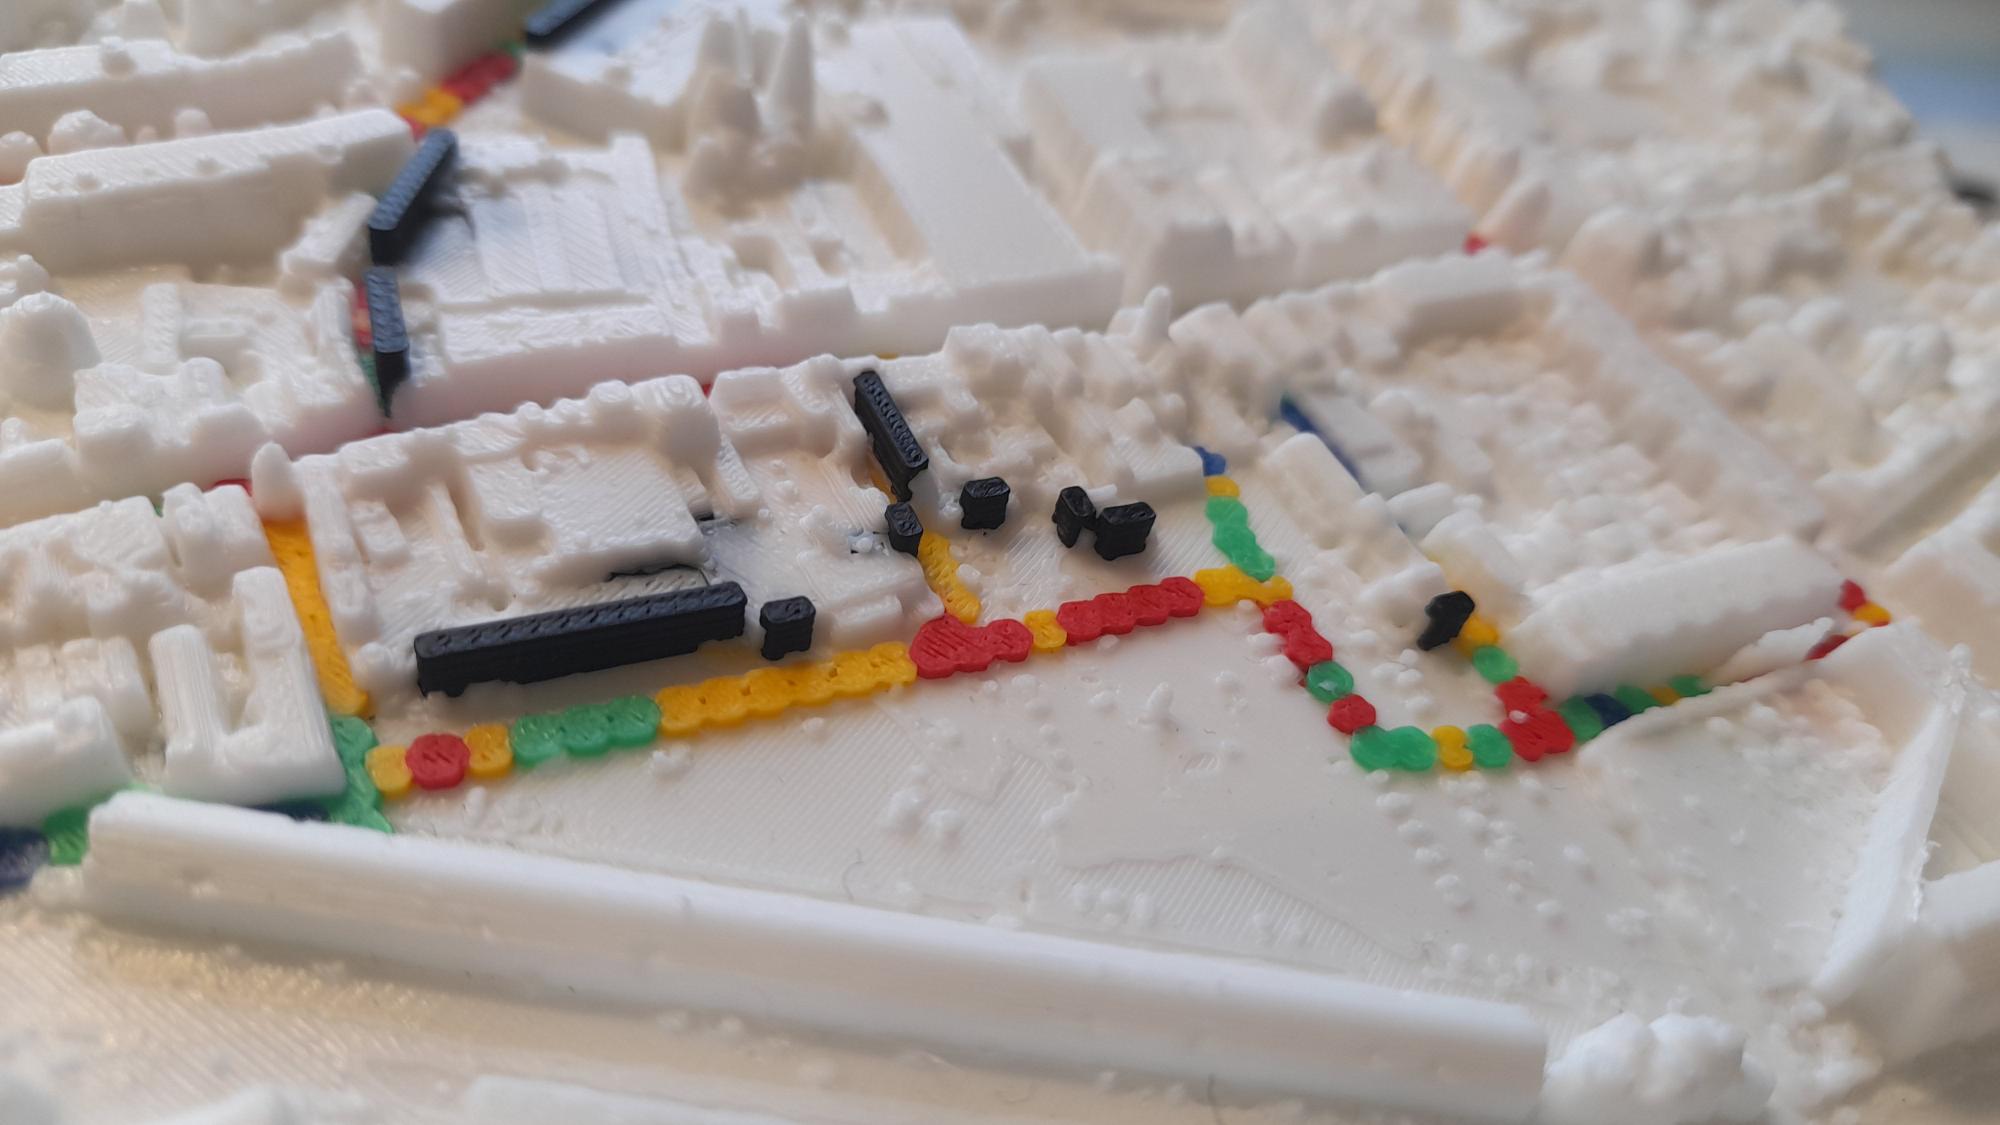
On the model, you see where each wall is, how it relates to the streets around it, and where visitors’ emotions rose and fell. The 3D context makes the data easy to grasp, even for people who never work with maps.
That is what the Places & Flows Lab offers: turning how people feel about a place into something you can see, hold and discuss.
Current Research Areas
- Tourism & Leisure — Understanding visitor flows and emotional experiences at destinations
- Spatial Planning — Supporting urban and rural planning decisions with tangible data visualization
- Climate Adaptation — Visualizing flood risk, land-use change, and environmental impact
- Cultural Heritage — Helping heritage sites improve visitor experience through emotion mapping
- Mobility — Analyzing how people move through cities and landscapes
Work With Us
Our research is driven by the interests of our institute and our students — in the form of thesis and course assignments — or commissioned by industry partners at commercial rates.
Interested in collaborating? Contact us at placesandflows@buas.nl